How Much More Did We Spend on Utility Bills Working From Home?
Working from home is a controversial subject in the UK.
Ask one person, they’ll say it's the future of working and that only by offering remote work can a business remain competitive for the best employees. Ask another, they’ll tell you about the havoc working from home will wreak on the wider economy that relies on office workers once this pandemic resides. And ask one more, and they’ll tell you working from home is a great way to save money. With no need to pay for overpriced trains or stale sandwiches, office workers are saving thousands of pounds each year.
Now, while the first two arguments are generally quite subjective topics, where the argument largely rests on your opinion, we thought the argument about how office workers can save money was quite interesting.
If, like us, you’ve noticed that since the pandemic started the cost of your utility bills has started to rise - you too might be questioning whether working from home can really save you money. With the 9 to 5 conducted in our living rooms, cooking lunches at home and generally home earlier during the evening - surely this is somehow offsetting the savings made on the daily commute?
With this in mind, the data experts here at Anchor Pumps wanted to find out - how much more are we spending on gas, electricity and water working from home? And is this enough to offset the savings made via the daily commute and lunches from Pret?
Find our results below - and yes, you really are spending hundreds of extra pounds on utilities each year!
The Difference Between a Working Day and Weekend
The best way to figure out how much more we’re spending on utility bills working from home is to look at our energy consumption at the weekend compared to a weekday prior to the pandemic.
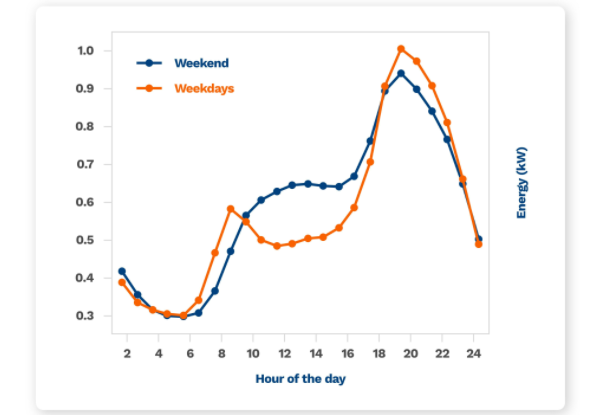
Now, the general rule is that we see a 20% increase in energy consumption when comparing the average weekend day to the average weekday. That can be seen in this graphic below.
Sourced from ResearchGate, you can see that while we generally consume more energy during a weekday at peak times such as 8 am and 6 pm, we see a big drop in our energy consumption between the hours of 10 am and 4 pm.
While previously we would have saved money by using electricity, heating and water in the workplace, with working from home - you won’t get that 20% drop during the day. The question is - how much is that extra 20% per day costing you?
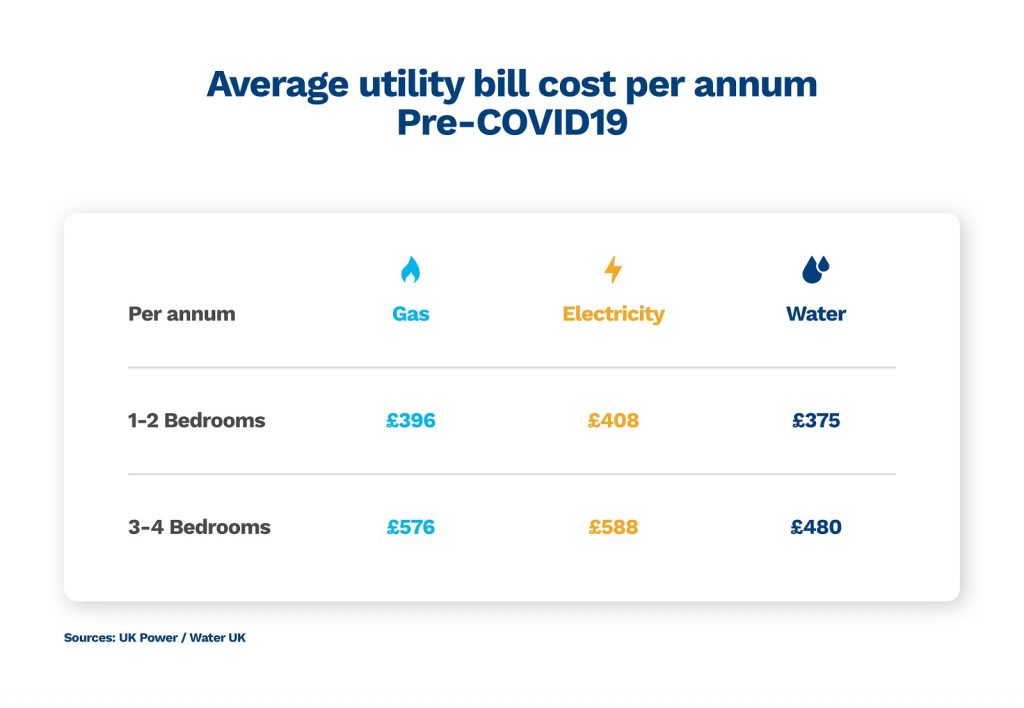
Average Annual Utility Bill - Pre-Covid 19
The best way to find out how much that extra 20% increase in energy is costing you is to look at the average annual utility bill prior to the pandemic.
Based on data from UK Power, depending on the size of your house and the number of occupants, you were looking at an annual bill of somewhere between £400 and £600 for gas and electricity. While water was costing you around about £350 to £500, depending on where you live.
So, to figure out how much extra we’re saving, all we need to do is figure out the average daily cost and add the extra 20% to weekdays. That works out as the following.
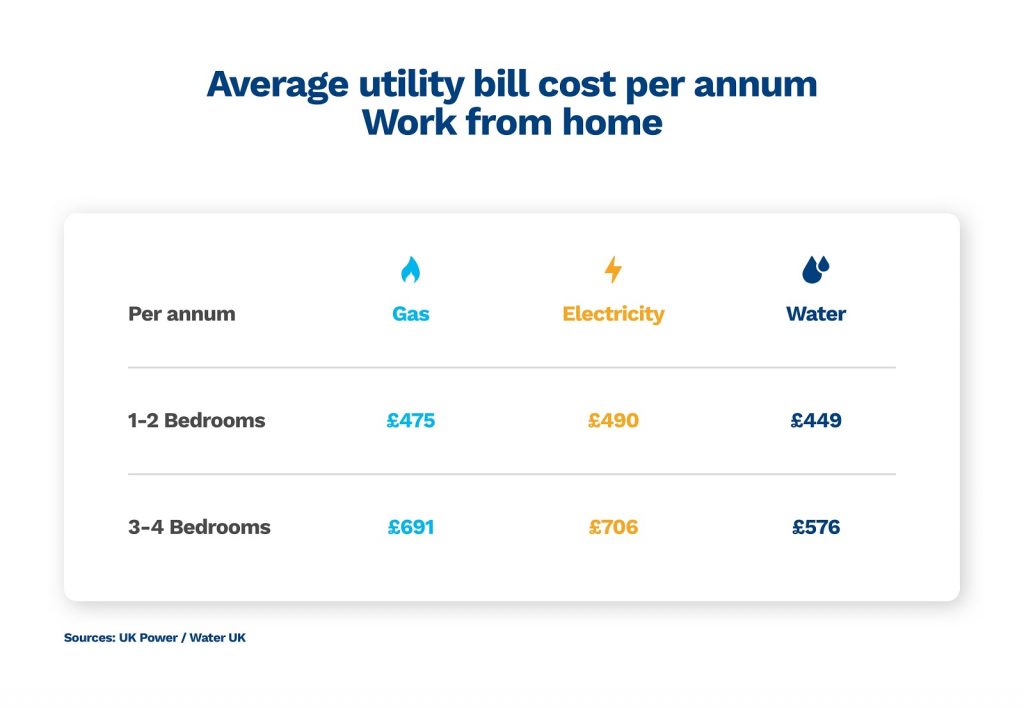
Average Annual Utility Bill - Working from Home
Based on our calculations, you can now look forward to annual gas and electricity bills in the region of £500 to £700 pounds per year, with water bills reaching around £500 to £600 per year depending on where you live.
Again, this is just an average for two different types of home, so your bills may vary depending on where you live.
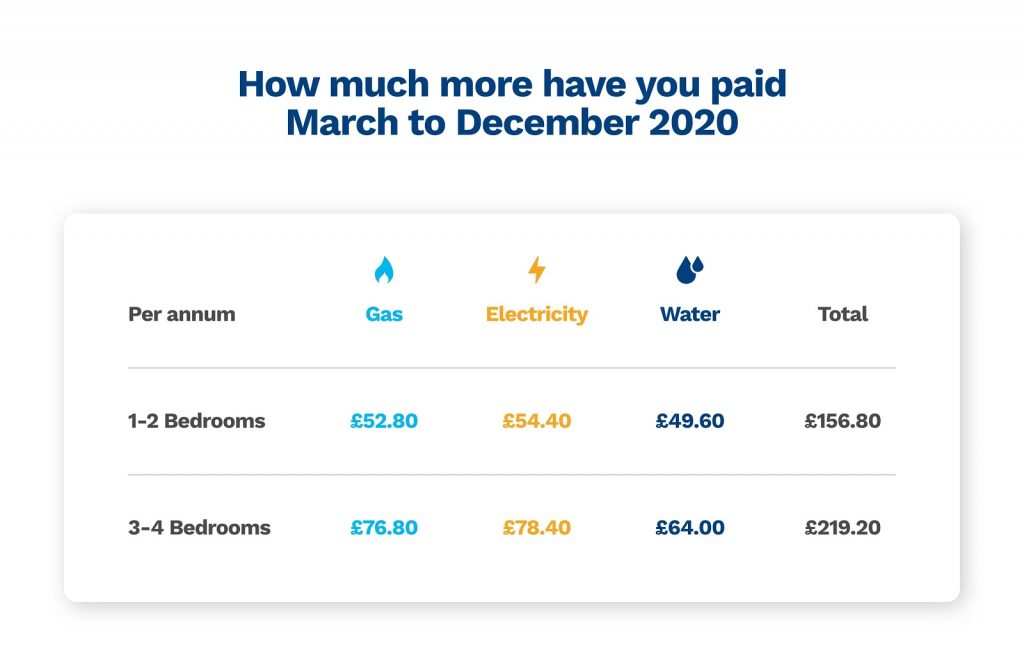
How Much More Have You Paid - March 2020 to December 2020
So, to answer the question we set ourselves originally:
If you live in a 1 to 2 Bedroom house, you will have paid an extra £156.80 for the privilege of working from home throughout the pandemic. Or £3 extra per week.
If you live in a 3 to 4 bedroom house, you will have paid somewhere in the region of £220.20. Or £4.25 extra per week
Obviously, as this is just an average, it will vary depending on where you live, the number of occupants etc.
So, how does that compare to the savings you make on the daily commute?
Utility Bills vs Commuting Costs
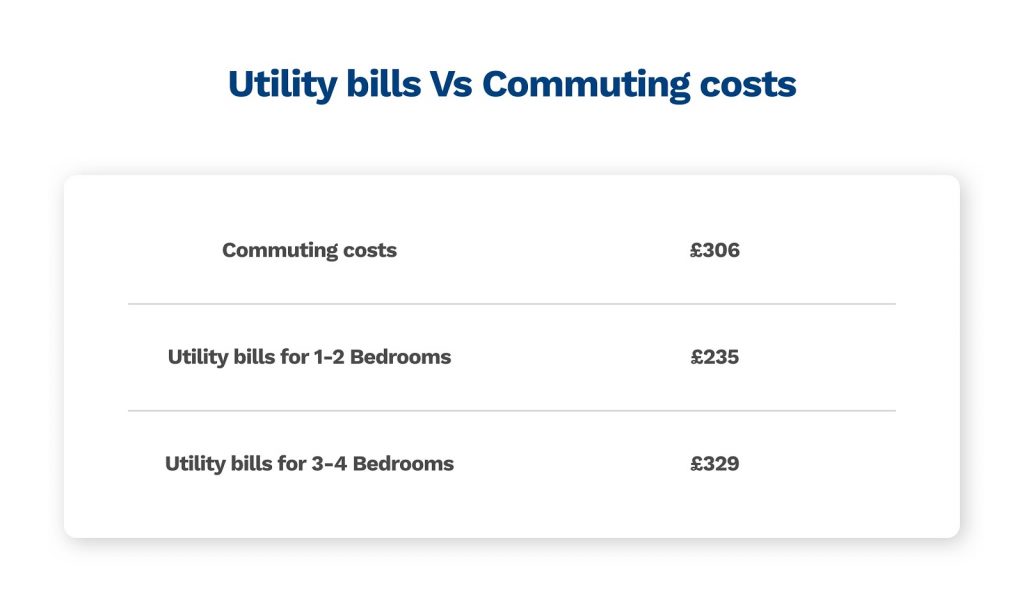
According to the ONS, the average daily commute in 2019 was 9.3 miles. Based on 232 working days and an average 1 Litre engine car, the RAC estimate that your average fuel cost for a year is about £306. Again, this is based on average data and if you get the train or bus to work, you might be looking at paying double, triple or even higher commuting costs each year.
So, as you can see, the two costs are just about breakeven, with commuting costs slightly higher if you live in a small house, while slightly lower if you live in a bigger 3 to 4 bedroom house.
Methodology
This data was collated using a variety of sources. Sources include:
UK Power
Water UK
RAC
UK Office of National Statistics
View the raw data here


